 yjoshi.dev
SUPERVISED LEARNING & REINFORCEMENT LEARNING
PayerBench Training
Supervised learning and RL on payer adjudication.
Results from training Qwen3 8B on de-identified claims, evaluated against actual insurer remittances. Compare supervised fine-tuning, two RL runs, and frontier-model baselines on the same held-out claims.
01Summary
Supervised fine-tuning raises Qwen3 8B’s class-balanced full-prediction score from 48.7% to 55.3%: +6.7 percentage points, with a paired 95% interval of [4.4, 9.1]. Denied-claim performance rises from 10.8% to 27.6%; paid-claim performance stays at 94.8%.
RL seed 2 reaches 56.1% overall, +0.8 points over SFT [−1.2, 2.8]. Its denied-claim score increases to 35.2%, while its paid-claim score falls to 86.0%. RL seed 1 reaches 50.8% overall, 38.4% on denied claims, and 66.0% on paid claims. Both runs start independently from the same SFT checkpoint.
All headline results use 750 held-out claims, balanced across paid, partial, and denied outcomes. Passing requires the correct claim class, graded service-line outcomes, and reason-code numbers.
02What training changed
All results below use the same 750 held-out claims and the prediction-integrity scorer revision of October 22, 2026. Saved predictions were replayed through the revised grader; no new model inference was used. The benchmark score requires the complete claim, service-line, and reason-code prediction.
All completed runs, ranked by overall score
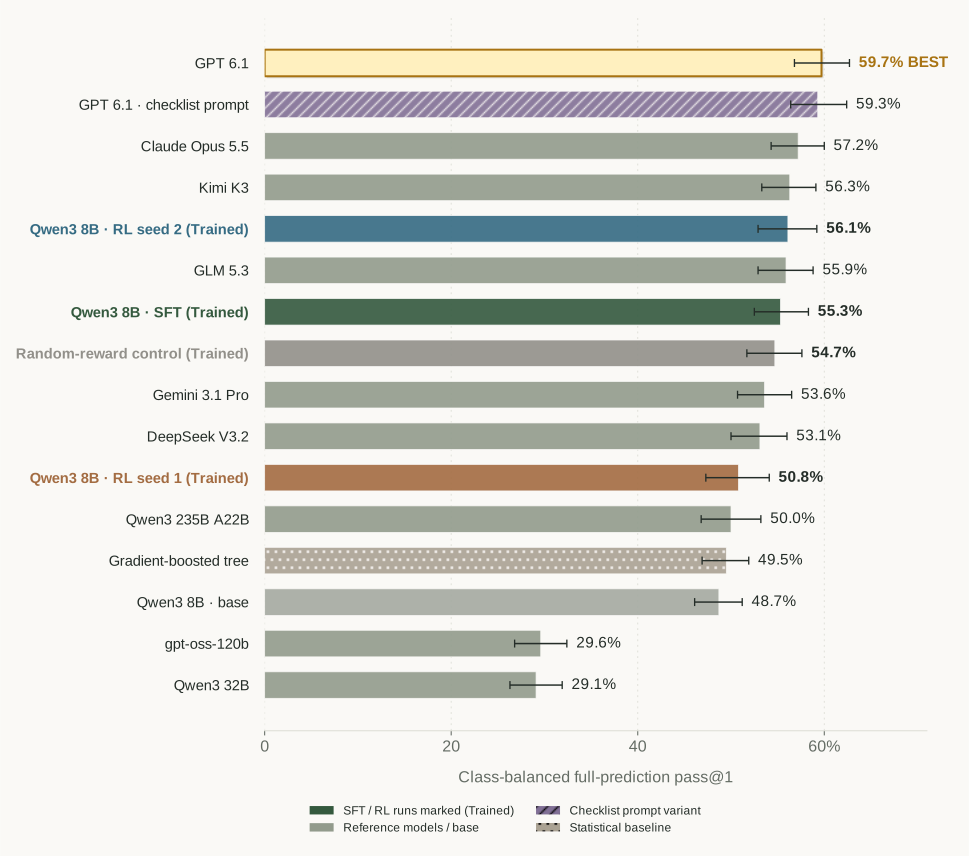
FIGURE 1. All 16 completed comparable runs, ranked by class-balanced full-prediction pass@1, with 95% class-stratified bootstrap intervals from 4,000 resamples. Gold marks the highest observed score. SFT, both RL seeds, and the random-reward control carry an explicit “(Trained)” label. The checklist prompt variant and statistical baseline are separately identified.
The comparison includes every completed model configuration in this evaluation and the class-balanced tree baseline. The Opus checklist attempt was stopped amid API errors; earlier training experiments used different evaluation setups. Those runs are excluded from this comparison.
SFT: +6.7 points overall, with a paired 95% interval of [4.4, 9.1]. RL seed 2 adds 0.8 points over SFT [−1.2, 2.8]; seed 1 falls 4.5 points [−7.2, −1.9]. The current RL recipe does not establish a reliable overall improvement over SFT.
All runs by actual claim outcome
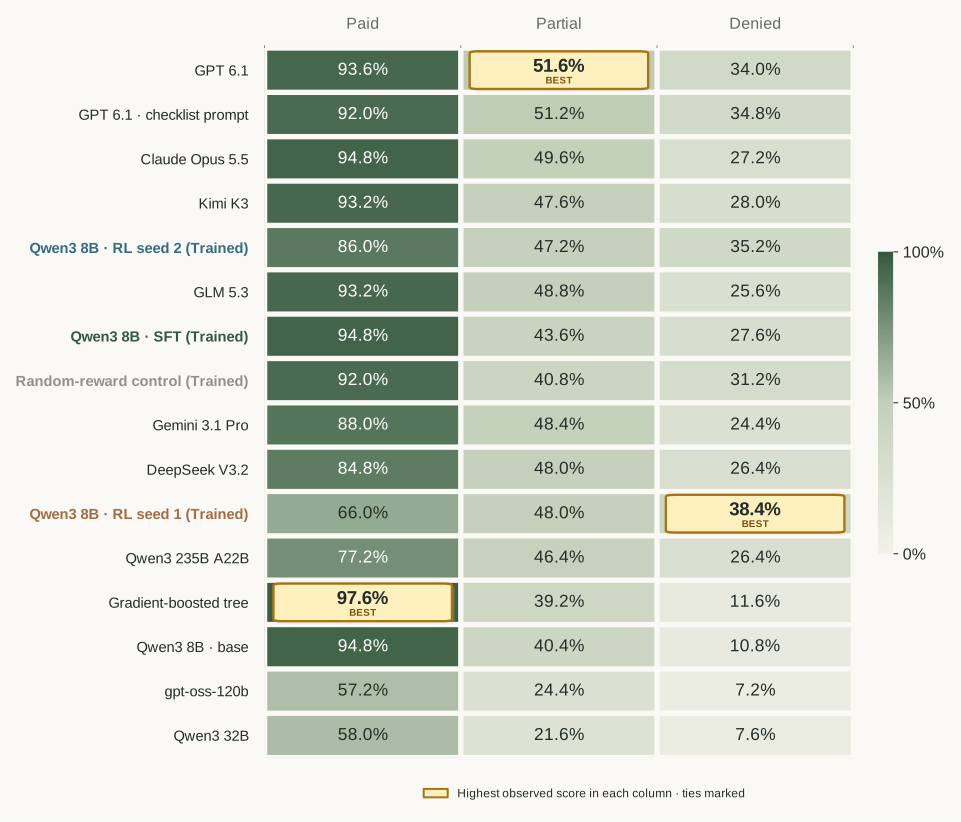
FIGURE 2. Full-prediction pass within each actual outcome class, using the same overall ranking as Figure 1. Gold raised cells mark the highest observed score in each column, including ties; other cells use the green 0–100% scale. The tree leads on paid claims, GPT 6.1 on partial claims, and RL seed 1 on denied claims. Highlights indicate point estimates, not statistically established superiority.
| Model / checkpoint | Overall | Paid | Partial | Denied | Paid false alarms ↓ |
|---|---|---|---|---|---|
| GPT 6.1Reference model | 59.7%[56.8, 62.7]Best | 93.6 | 51.6Best | 34.0 | 6.4 |
| GPT 6.1 · checklist promptPrompting variant | 59.3%[56.4, 62.4] | 92.0 | 51.2 | 34.8 | 8.0 |
| Claude Opus 5.5Reference model | 57.2%[54.3, 60.0] | 94.8 | 49.6 | 27.2 | 5.2 |
| Kimi K3Reference model | 56.3%[53.3, 59.1] | 93.2 | 47.6 | 28.0 | 6.0 |
| Qwen3 8B · RL seed 2 (Trained)Trained checkpoint | 56.1%[52.9, 59.2] | 86.0 | 47.2 | 35.2 | 14.0 |
| GLM 5.3Reference model | 55.9%[52.9, 58.8] | 93.2 | 48.8 | 25.6 | 6.0 |
| Qwen3 8B · SFT (Trained)Trained checkpoint | 55.3%[52.5, 58.3] | 94.8 | 43.6 | 27.6 | 5.2 |
| Random-reward control (Trained)Trained control | 54.7%[51.7, 57.6] | 92.0 | 40.8 | 31.2 | 8.0 |
| Gemini 3.1 ProReference model | 53.6%[50.7, 56.5] | 88.0 | 48.4 | 24.4 | 6.8 |
| DeepSeek V3.2Reference model | 53.1%[50.0, 56.0] | 84.8 | 48.0 | 26.4 | 14.8 |
| Qwen3 8B · RL seed 1 (Trained)Trained checkpoint | 50.8%[47.3, 54.1] | 66.0 | 48.0 | 38.4Best | 34.0 |
| Qwen3 235B A22BReference model | 50.0%[46.8, 53.2] | 77.2 | 46.4 | 26.4 | 14.8 |
| Gradient-boosted treeStatistical baseline | 49.5%[46.9, 51.9] | 97.6Best | 39.2 | 11.6 | 2.0Lowest |
| Qwen3 8B · baseBase checkpoint | 48.7%[46.1, 51.2] | 94.8 | 40.4 | 10.8 | 3.2 |
| gpt-oss-120bReference model | 29.6%[26.8, 32.4] | 57.2 | 24.4 | 7.2 | 30.4 |
| Qwen3 32BReference model | 29.1%[26.3, 31.9] | 58.0 | 21.6 | 7.6 | 41.2 |
“Trained” identifies the Qwen3 8B checkpoints post-trained in these experiments, including the random-reward control. GPT 6.1 with a checklist is a prompting variant, without weight updates. The tree is tuned for class balance. Highlights identify point-estimate leaders, not statistically established superiority. Paid false alarms count actually paid claims classified as partial or denied. All 8B checkpoints use greedy decoding in non-thinking mode; reference models use their evaluated provider settings, as documented in PayerBench.
Download all 16 aggregate results (.csv) ↓Catching more denials has a visible cost
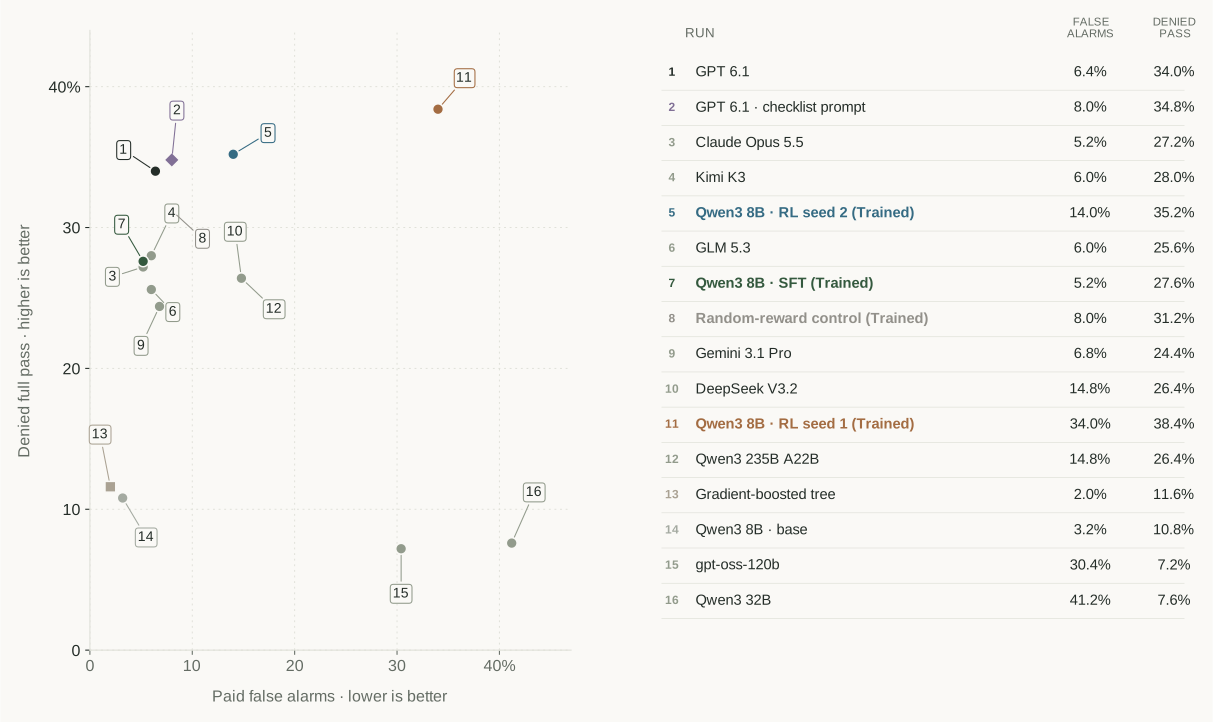
FIGURE 3. Higher and left is preferable. Numbers identify the same runs in the adjacent key, with exact false-alarm and denied-pass rates. DeepSeek and Qwen3 235B share an operating point. The vertical metric is complete denied-claim prediction; the horizontal metric counts actually paid claims classified as partial or denied. Each point is one evaluated policy, not a threshold sweep or a matched-false-alarm-rate comparison.
RL’s denied-claim point estimates exceed GPT 6.1: 38.4% and 35.2%, versus 34.0%. The paired differences are +4.4 points [−0.4, 8.8] and +1.2 [−3.2, 5.2], so these results do not establish superiority. Paid false alarms rise to 34.0% and 14.0%, versus GPT 6.1’s 6.4%.
Which gains survive a paired comparison?
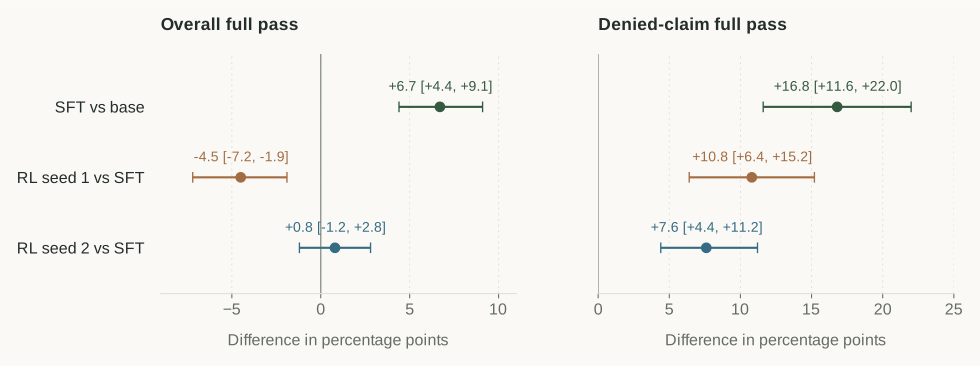
FIGURE 4. Paired bootstrap differences retain which claims each policy got right. Point differences are computed before rounding; they may differ by 0.1 from subtracting the displayed headline scores. Overall and denied intervals are resampled within their respective evaluation populations.
What this evidence supports
- Learnability through supervised training. The held-out SFT gain is clear for this model and recipe, particularly on denied claims.
- Denial gains and paid-claim false alarms. Both RL seeds improve denied-claim full pass over SFT while increasing false alarms on paid claims.
- RL remains an open optimization problem. Two short runs are insufficient to establish robust gains across seeds or larger models. The random-reward control scores 54.7%, close to SFT’s 55.3%.
- Scope is specific. One platform, a three-specialty evaluation dominated by allergy / immunology, one run per policy, and no measured human-expert baseline. Missing evidence can limit how well the payer response is predictable.
The shown RL policies were trained before the later prediction-integrity rescore. Rescoring measures their saved behavior under the tighter verifier; it does not mean they were retrained with that revision.
03Evaluation metrics
The primary comparison is RL seed 2 against the same supervised checkpoint, paired on the same 750 observed claims. Each result includes its evaluation scope and any measurement limits.
All 15 evaluation metrics
| Metric | Current evidence and scope |
|---|---|
| Frontier model baseline | measured59.7% pass@1 GPT 6.1; 95% CI [56.8, 62.7] on the balanced 750-claim test. |
| Held-out capability gain after RL | measured+0.8 pp overall; +7.6 pp on denied claims Seed 2 vs SFT. Paired 95% CIs: overall [−1.2, 2.8]; denied [4.4, 11.2]. Seed 1 overall: −4.5 pp. |
| Unseen task-family gain | unmeasuredNot measured All six constructed rule families appear in training. Their test score is not an unseen-family transfer result. |
| Production-derived holdout gain | measured+0.8 pp incremental RL; +7.5 pp for SFT + RL Same 750-claim test, not an independent replication. Pipeline vs base CI [4.7, 10.1]; incremental RL CI includes zero. |
| Sim2Real transfer efficiency | not applicableNot applicable Training and evaluation use production-derived claims. The reported setup has no separate simulator-to-production transfer stage. |
| Human / reward agreement | unmeasuredNot measured Labels are observed insurer remittances. No independent expert agreement study has been completed. |
| Reward false-positive rate | unmeasuredNot established Requires an independently adjudicated correctness set. Targeted mutation checks do not estimate this rate. |
| Reward exploit rate after red-teaming | scoped0 / 2,247 fixed attacks rewarded (0%) Targeted audit only: fabricated lines, excess duplicates, and contradictory claim classes on 749 accepted references. Open-ended red-team exploit rate is unmeasured. |
| Effective environment scale | scoped18,445 training task IDs / 6 controlled families 12,618 observed-claim tasks + 5,827 constructed tasks. Distinct IDs verified; semantic non-redundancy has not been audited. |
| Saturation point | scopedNot established; 7,752 rollouts per RL seed observed Ten completed updates per seed. Seed 2 dev score peaks at step 15 then falls at step 20; this does not establish a saturation budget. |
| Throughput | scoped2.83 rollout attempts/sec Seed 2: 7,752 attempts / 2,738 rollout seconds on the reference 8B/H100 setup. 0.42/sec including updates; excludes validation and setup. |
| Environment reliability | scoped99.6% valid evaluated completions (1,550 / 1,556) Seed 2, final saved results after retries: prediction present, process and integrity pass. Includes model behavior; not an environment uptime SLA. |
| Cost per 1M valid episodes | scopedNot measured; approximately $93 reported experiment spend Reported total covers this version’s SFT, RL seeds, control, and evaluation (29 GPU-hours). No validated per-million unit cost. |
| Learning efficiency per $10K training | scopedNot established; 3,876 rollouts to the selected RL checkpoint Seed 2 adds 0.8 pp after five updates. Logged rollout + update time: 2.72 GPU-hours, excluding SFT, validation and setup; no $10K extrapolation. |
| Synthetic substitution gap | unmeasuredNot measured No matched training comparison against a strongest cheap synthetic replica. Trivial baselines and constructed tasks do not substitute for that experiment. |
The fixed attack suite was run on October 22 against the current verifier, without model inference. One of 750 canonical reference answers fails because of the previously identified claim/line label inconsistency; the 2,247 mutations use the other 749 references. This audit does not establish human agreement or open-ended adversarial robustness.
04A dataset with the workflow attached
The corpus contains 24,302 de-identified outpatient claims and 47,613 service lines from Arrow’s revenue-cycle platform, spanning five specialties and 486 payers. The records preserve claim structure and actual payer outcomes, together with the evidence exposed by the environment.
Earlier claims
Earlier claims
750 in this evaluation
The later period begins June 1, 2026, after all training and development service dates. Training and development are separated by patient; test patients may have earlier training claims. The 750-claim evaluation is balanced: 250 paid, 250 partial, and 250 denied.
- Corpus specialties
- Allergy / immunology, dermatology, orthopedics, primary care, and urgent care
- Evaluated population
- 558 allergy / immunology, 165 dermatology, 27 orthopedics · 95 payers
- Controlled rule tasks
- 5,827 constructed training tasks · 806 test tasks, reported separately
- Six controlled families
- Authorization, duplicates, diagnosis coverage, provider identifiers, timely filing, and visit limits
De-identification. Names and direct identifiers are removed or replaced; dates and demographic details are transformed while preserving the relationships needed for the task. The pipeline uses the HIPAA Safe Harbor identifier list as its basis, with additional checks for rare combinations.
Corpus counts describe the complete research snapshot. Training runs and the held-out evaluation use the subsets specified above.
05Evidence in. A verifiable prediction out.
An episode starts with a submitted claim. The agent chooses which evidence to inspect, then calls predict_adjudication once. The payer’s response is withheld from the evidence tools and used as the grading target.
get_claim
The agent starts with the submitted claim.
A visit and an allergy-injection service appear on the same claim. The insurer’s answer is withheld.
- Service line 1
- Office visit
- Service line 2
- Allergy injection
- Available evidence
- Eligibility, authorizations, code edits, payer rules, history
{
  "claim": "fictional-example",
  "serviceLines": ["office_visit", "allergy_injection"],
  "payerOutcome": "withheld"
}
Fictional walkthrough, with simplified outputs for readability. It illustrates the task and feedback; it is not a customer record or a complete API schema.
Nine tools, a 12-call budget
The budget includes the terminal prediction. Payer rules and similar claims are derived from the training split and exclude the current patient.
| Layer | Required for full credit |
|---|---|
| Claim | The correct paid, partial, or denied class. |
| Service lines | The correct outcome for every graded line and matching reason-code numbers on adverse lines. |
| Integrity | Consistent claim and line classes; no unexpected service lines or excess duplicates. |
| Process | Read the claim first, make valid tool calls, and stay within the episode budget. |
The benchmark’s full-pass metric does not score paid dollar amounts. The target is the observed insurer response; it is not an expert determination that the payer’s decision was correct.
06From supervised evidence use to online RL
We tested the environment with Qwen3 8B in non-thinking mode, using rank-16 LoRA adapters. The same tool interface serves training and evaluation. The supervised stage establishes an evidence-reading policy; the RL stage samples alternative trajectories and updates from verifier feedback.
Both RL seeds and the control start from the same supervised checkpoint.
Supervised learning: teach an evidence procedure
Training examples open the evidence sources, build a checklist from returned facts, and submit the prediction. Paid claims remain in the pool, including cases where a warning cue does not lead to a denial. Partial and denied training examples are retained only when the visible evidence supports every adverse line’s reason. This avoids teaching the model to invent an explanation for an unsupported label.
The supervised recipe uses a learning rate of 10⁻⁴ across 16 chunks, with checkpoint selection on dev150. The selected checkpoint is chunk 10. Test labels are not used for training or checkpoint selection.
Reinforcement learning: optimize sampled trajectories
The reference trainer uses ART with GRPO-style group-relative updates. Dynamic sampling seeks groups whose attempts receive different rewards, with 16 attempts for adverse claims and 8 for other tasks. Updates reweight outcome classes, with a target 15% share for constructed tasks. Reward standard-deviation scaling is disabled so the reward magnitudes retain their effect.
| Signal | Contribution |
|---|---|
| Full answer | 1.0 for a complete benchmark pass. |
| Related reason family | Otherwise 0.5 when the outcome, lines, patient share, reason families, and process checks pass, and the prediction is consistent. |
| Risk forecasts | +0.25 × the risk-track reward, based on Brier score. |
| Tool efficiency | −0.02 per call beyond 10, and per failed tool call. |
| Token efficiency | −0.05 per 10,000 tokens beyond 25,000. |
RL learning rate: 5 × 10⁻⁶. Each run has a six-hour cap and a maximum schedule of 60 additional steps; only about ten updates fit per RL seed. Checkpoints are evaluated on dev1000 every five steps. Both seeds select step 15, starting from SFT step 10. The control replaces the shaped reward with a seeded random binary reward.
This page reports aggregate results. Underlying claims, model traces, and trained adapters are not publicly distributed here. Both authors work at Arrow, which builds revenue-cycle software.
SOURCE: Saved PayerBench v2 evaluation aggregates, the October 22, 2026 prediction-integrity rescore, saved trainer timing logs, the targeted verifier audit, and the reference training and environment implementation. This brief describes the adjudication-prediction task; results do not establish performance on other revenue-cycle tasks.