 yjoshi.dev
RESEARCH / HEALTHCARE AI
PayerBench
Can AI agents predict how insurers adjudicate medical claims?
01Summary
Medical billing is a test of scattered evidence: coverage, authorizations, coding rules, and a payer’s past decisions. PayerBench measures whether an AI agent can put that evidence together and predict the insurer’s response.
The benchmark is built from de-identified records derived from real outpatient claims, paired with actual insurer remittance outcomes. An agent investigates each claim through nine tools, then predicts the overall outcome, each service line’s outcome, and the reason for any denial or reduction.
GPT 6.1 leads at 59.7%. Paid claims are much easier than adverse ones: its score falls from 93.6% on paid claims to 34.0% on denied claims. Getting the final label right is only part of the task; passing also requires the correct service-line predictions and reason-code numbers.
02Model results
One attempt per claim, the same instructions, nine evidence tools, and a 12-call budget. The headline score gives paid, partial, and denied claims equal weight.
PayerBench leaderboard
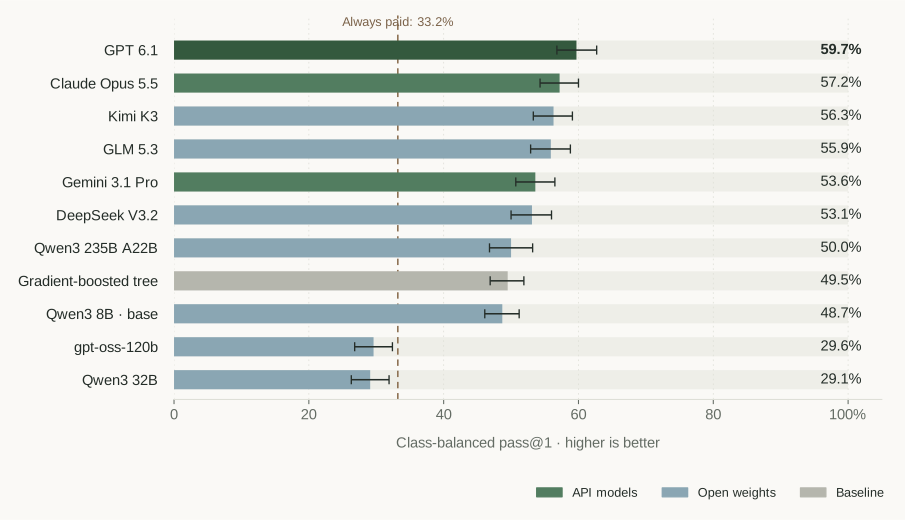
FIGURE 1. Class-balanced pass@1. Whiskers show 95% class-stratified bootstrap intervals across claims, using 4,000 resamples. The dashed line is the measured “always paid” baseline. Model names reflect the evaluated snapshots.
The difficult part is explaining adverse outcomes. The best models clear most paid claims, but their full-prediction scores on partial and denied claims remain substantially lower.
Where models succeed — and struggle
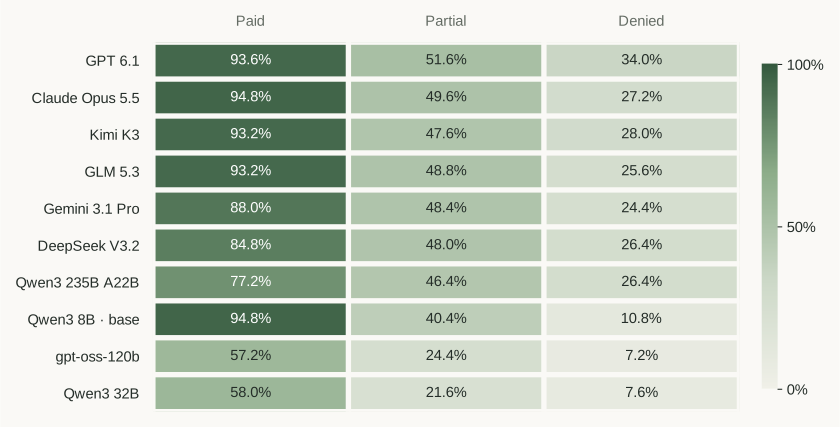
FIGURE 2. Full-prediction pass rate within each actual outcome class. Darker cells indicate higher scores; the color scale is fixed at 0–100%. “Paid” includes patient responsibility and zero-pay-to-deductible outcomes.
More tokens don’t guarantee a better result
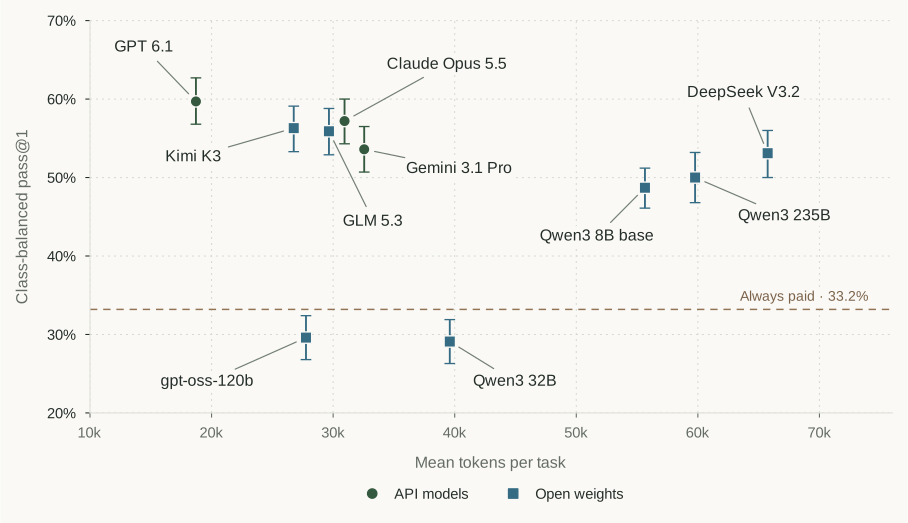
FIGURE 3. Score on the 750 de-identified claims versus mean token usage across all 1,556 evaluated tasks, including 806 constructed tasks. Token accounting and reasoning modes differ by provider; this plot measures reported usage, not dollar cost or a causal effect of token count. Vertical whiskers are score intervals. The score axis spans 20–70% to separate the models more clearly.
03The dataset
The source is Arrow’s revenue-cycle platform. Source records undergo de-identification before use in the benchmark. Claim forms are joined to eligibility checks, authorization records, and the payer’s first remittance for that submitted claim. The labels come from the insurer’s X12 835 response.
De-identification & data handling
The benchmark preserves procedure and diagnosis codes, service-line structure, and observed payer outcomes from actual billing workflows. Names and direct identifiers are removed or replaced; dates and demographic details are transformed while preserving the relationships needed for adjudication.
The de-identification pipeline uses the HIPAA Safe Harbor identifier list as its basis, with additional checks for rare combinations.
- Corpus coverage
- Five outpatient specialties · 486 named payers
- Service lines
- 47,613 across 24,302 claims
- Code diversity
- 545 procedure codes · 2,701 diagnosis codes
- Payer mix, by claims
- 74% commercial · 14% Medicare / MA
11% Medicaid · 1% other - Outcomes in the corpus
- 81.9% paid · 10.7% partial · 7.4% denied
- Reason codes
- 99 distinct adjustment reason codes on adverse lines
What the data covers
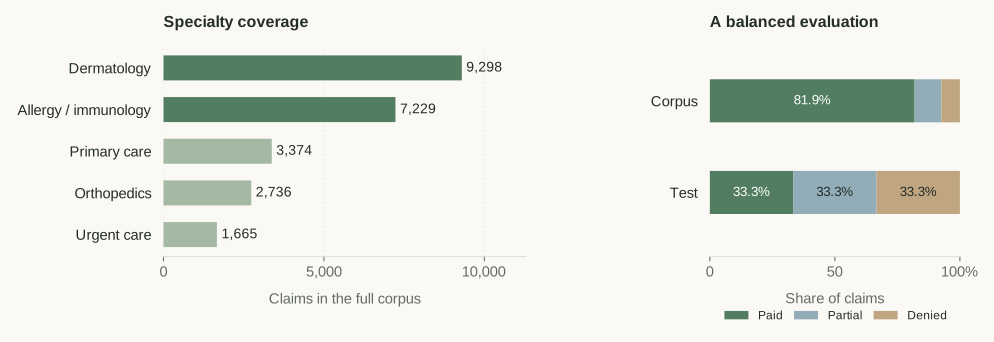
FIGURE 4. Left: claim counts in the complete corpus, by specialty. Right: the corpus’s natural outcome mix compared with the balanced test sample. Corpus partial and denied shares are 10.7% and 7.4%; each test class has exactly 250 claims. The evaluated specialties are allergy and immunology (558), dermatology (165), and orthopedics (27), across 95 payers.
The evaluated population
The headline comparison evaluates 750 claims across 95 payers: 558 allergy and immunology claims (74.4%), 165 dermatology claims (22.0%), and 27 orthopedics claims (3.6%). Primary care and urgent care are present in the full corpus but are not represented in this evaluation sample. The five specialties and 486 payers reported above describe the full corpus.
How the evaluation sample is drawn
Earlier de-identified claims
Earlier de-identified claims
750 used for this comparison
The split uses the original service date: the later period starts June 1, 2026. The comparison samples 250 paid, 250 partial, and 250 denied claims from that period. Training and development are separated by patient; test patients may have earlier claims in training. The draw also matches the rate of recorded submission dates across outcome classes.
An additional 7,413 constructed tasks test six specific rules, with 806 in the test period. These are separate from the 750 de-identified claims and are excluded from the headline leaderboard.
04Methodology
Each episode asks an agent to investigate one claim and commit one prediction. The payer’s response is withheld from the tools and used as the grading target.
- Gather the evidence. The agent chooses among the nine read tools. Payer rules and similar examples are built from training claims, excluding the current patient.
- Predict the insurer’s response. Return the claim class, the outcome of each billed service line, and reason codes for denied or reduced lines. The episode has a 12-call budget, including the terminal prediction.
- Grade against the first remittance. Passing requires the correct claim class, every graded line outcome, and a matching first non-contractual reason-code number for each denied or reduced line. The complete prediction must also have consistent claim and line classes, without unexpected service lines or excess duplicates. The claim must be read first. Paid dollar amounts are not scored.
- Balance the outcomes. Average full-prediction pass rates across paid, partial, and denied claims. This prevents the large paid majority from dominating the headline.
For example, GPT 6.1 scores (93.6 + 51.6 + 34.0) / 3 = 59.7%, after rounding. Correct claim classification alone scores 70.3%, which shows why service-line and reason-code checks matter.
05Limitations & access
- A specific data population. One revenue-cycle platform. The corpus spans five outpatient specialties; the evaluated sample covers three and is dominated by allergy and immunology. These results do not establish performance on primary care, urgent care, inpatient, facility, or dental claims.
- One run per model. Providers, default reasoning settings, and serving configurations vary. The confidence intervals capture differences across sampled claims, not run-to-run variation. No human-expert baseline has been measured.
- Incomplete evidence. Recorded information may not explain a payer’s decision. A payer’s observed response is the prediction target; it is not necessarily a judgment that the response was clinically or contractually correct.
- Selection affects the result. Conflicting outcome groups were removed using the full corpus before splitting. This narrows the retained population and can influence reported performance.
The underlying customer claims remain private. This page contains aggregate results only. Both authors work at Arrow, which builds revenue-cycle software. Public data samples and evaluation code are not included.
SOURCE: PayerBench draft v2 · October 21, 2026 · Table 1, Sections 3–5, and saved evaluation aggregates. Scores were recomputed from saved model traces with the prediction-integrity checks on October 22, 2026. No new model inference was used. This page presents benchmark results only.